
Brightfield immunohistochemistry (IHC) continues to play a central role in tissue-based biomarker analysis, providing a visual window into complex biological processes. Through chromogenic staining, protein and RNA targets can be localised within the intact tissue architecture, preserving the spatial relationship between cells and their microenvironment. Accurate isolation of signal from stains used to identify targets is a key step in image analysis workflows. When staining is clean and consistent, conventional deconvolution methods generally perform well, however, multiplex assays such as multiplex IHC (mIHC) and RNAscope introduce additional complexity, as overlapping chromogenic signals make it more difficult to isolate each stain individually. In a recent dual RNAscope project, we encountered these limitations first-hand.
This blog walks through the approaches we tested, from pre-defined colour deconvolution, through custom deconvolution, to an AI-driven workflow, and explains why deep learning ultimately provided the robust stain separation the project required.
Colour deconvolution is typically used to view overlapping stains separately. Based on Beer-Lambert law, it models how each stain absorbs light according to its characteristic optical density profile, generating a separate feature for each stain so they can be considered individually.
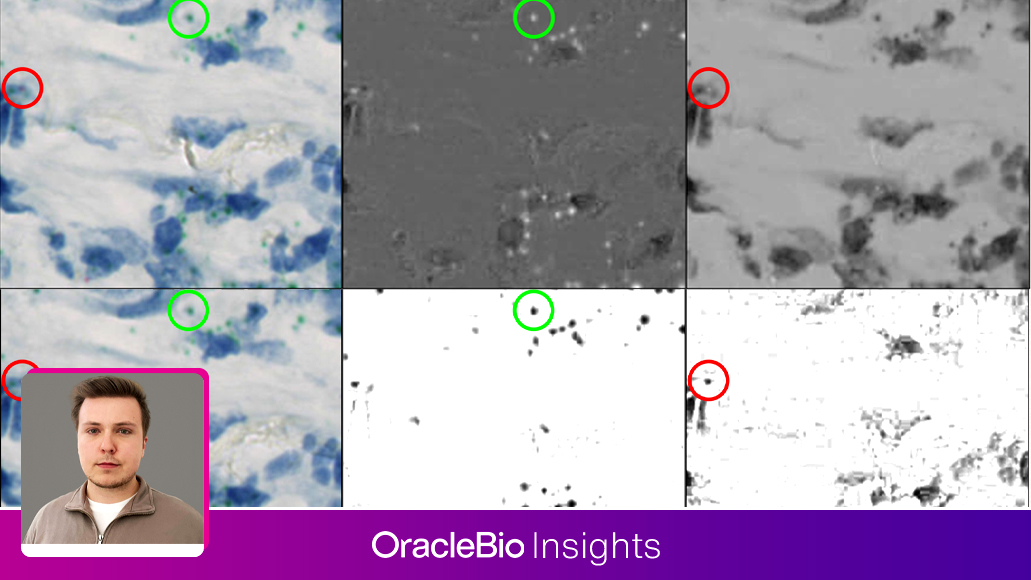
Our first step was to explore the pre-defined colour deconvolutions available in Visiopharm. The dual RNAscope assay included green and purple chromogens for two RNA targets of interest, with samples counterstained with haematoxylin. For singleplex IHC, the pre-defined settings are often sufficient for separating a single chromogen from a haematoxylin counterstain, however, in this multiplex RNAscope panel, accurate stain separation was challenging. The green chromogen isolated well, with minimal signal overlap from other stains (Figure 1B), but isolation of the purple chromogen was less accurate, as the signal was weak and tissue damage and artefacts presented with similar pixel intensities in the selected colour deconvolution (Figure 1C).

Figure 1: Default Colour Deconvolution Performance. A) Example tissue area with green and purple chromogen probes, and the associated B) green chromaticity feature to capture green probes, and C) red chromaticity feature to capture purple probes. The green circle highlights an example of a green probe, and the red circle highlights an example of a purple probe. In the features, a positive probe signal presents as a peak of white pixels.
Natural staining variability added a further layer of complexity. RNA probe signal varied in both intensity and cellular localisation, as the haematoxylin counterstain distorted the colour profile of nuclear-localised probes. To overcome the limitations of pre-defined colour deconvolutions, Visiopharm allows users to generate custom colour deconvolution features. This gives our Image Analysts the ability to emphasise specific stains of interest while suppressing signal from competing stains.
Custom deconvolution was able to successfully separate the green chromogen, which was generally clean and distinct (Figure 2B). However, even with this approach, the purple chromogen remained difficult to isolate, as the intense haematoxylin counterstain continued to contribute signal to the deconvolved feature (Figure 2C).
Natural pigments, such as black carbon deposits, also created challenges for image analysis due to their high optical density and near-black appearance. Because they absorb light across all colours, they lack a distinct signature that can be reliably separated.
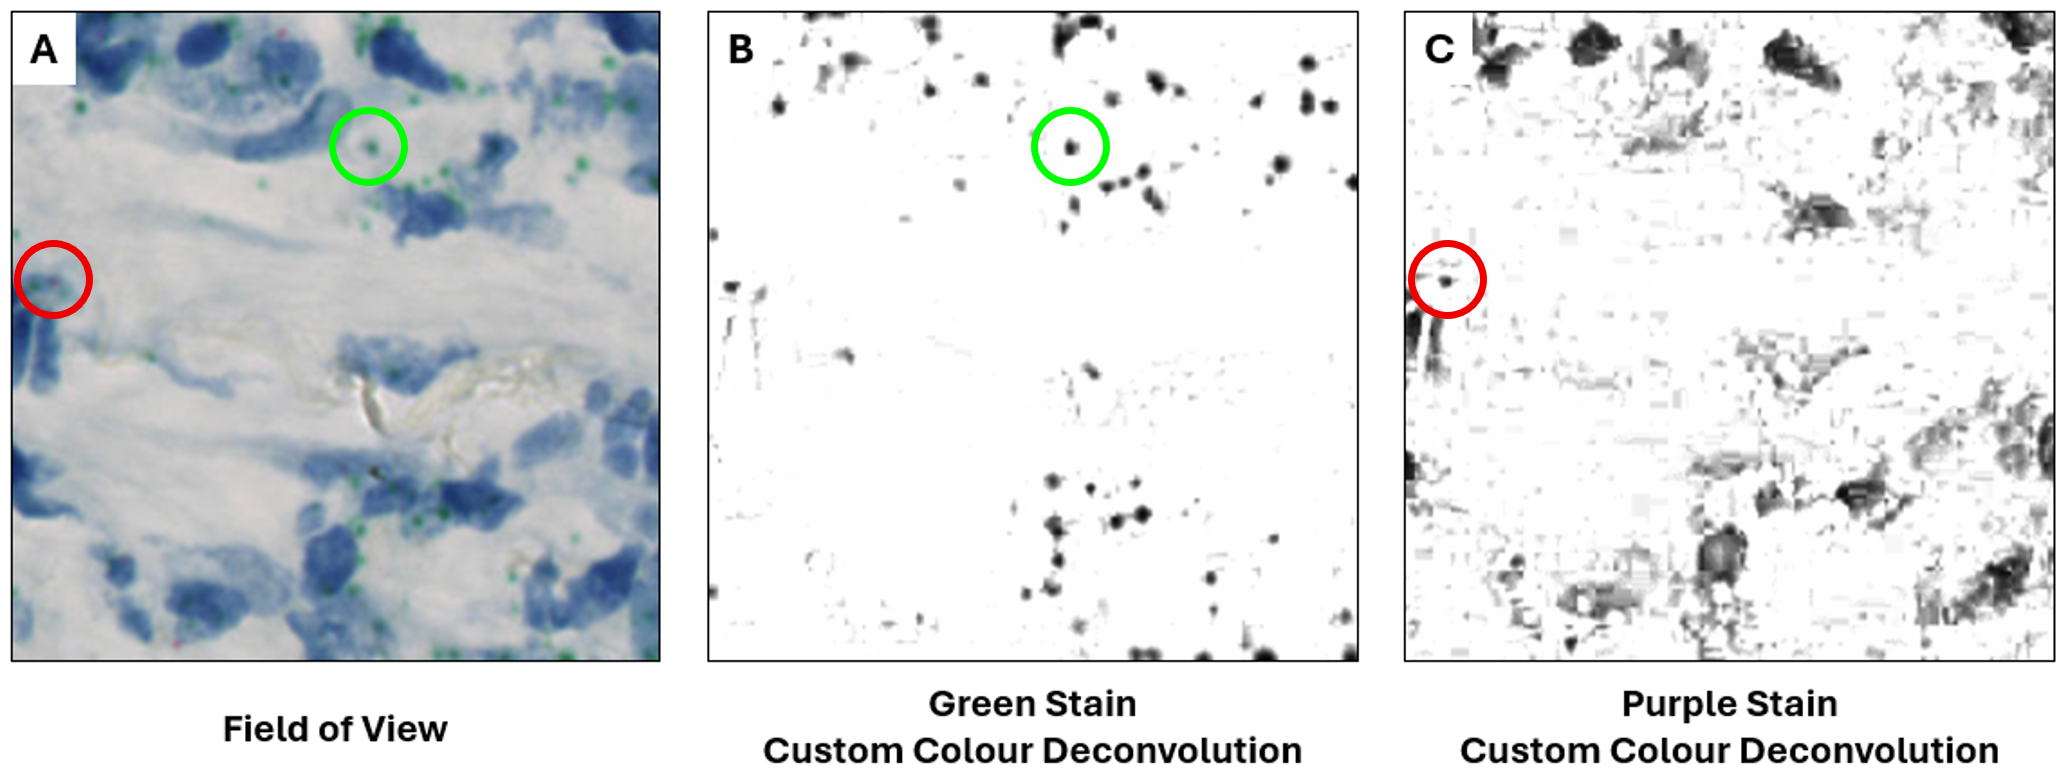
Figure 2: Custom Colour Deconvolution Performance. A) Example tissue area with green and purple chromogen probes, and the associated B) custom green stain colour deconvolution, and C) custom purple stain colour deconvolution. The green circle highlights an example of a green probe, and the red circle highlights an example of a purple probe. In the features, a positive probe signal presents as a peak of black pixels.
At this stage, it was evident that traditional colour deconvolution, even when customised, would not provide the specificity required for this project.
To address these challenges, we utilised the deep learning models available in Visiopharm to develop an AI-powered workflow. This approach enabled robust separation of overlapping stains by moving beyond the constraints of conventional optical density-based unmixing, and instead leveraged deep learning (DL)-derived features to distinguish true chromogenic signal.
We trained the algorithm to recognise signal from each stain separately, creating individual features for the two stains of interest while minimising interference from artefacts present in the tissue. As with any deep learning-based algorithm, it was important that the training data captured the full heterogeneity of staining across the image set to maximise generalisability and robustness. As shown in Figure 3, overlapping signals from counterstains and artefacts were suppressed in the DL features, resulting in improved detection of weak RNA probe signals that were previously obscured.
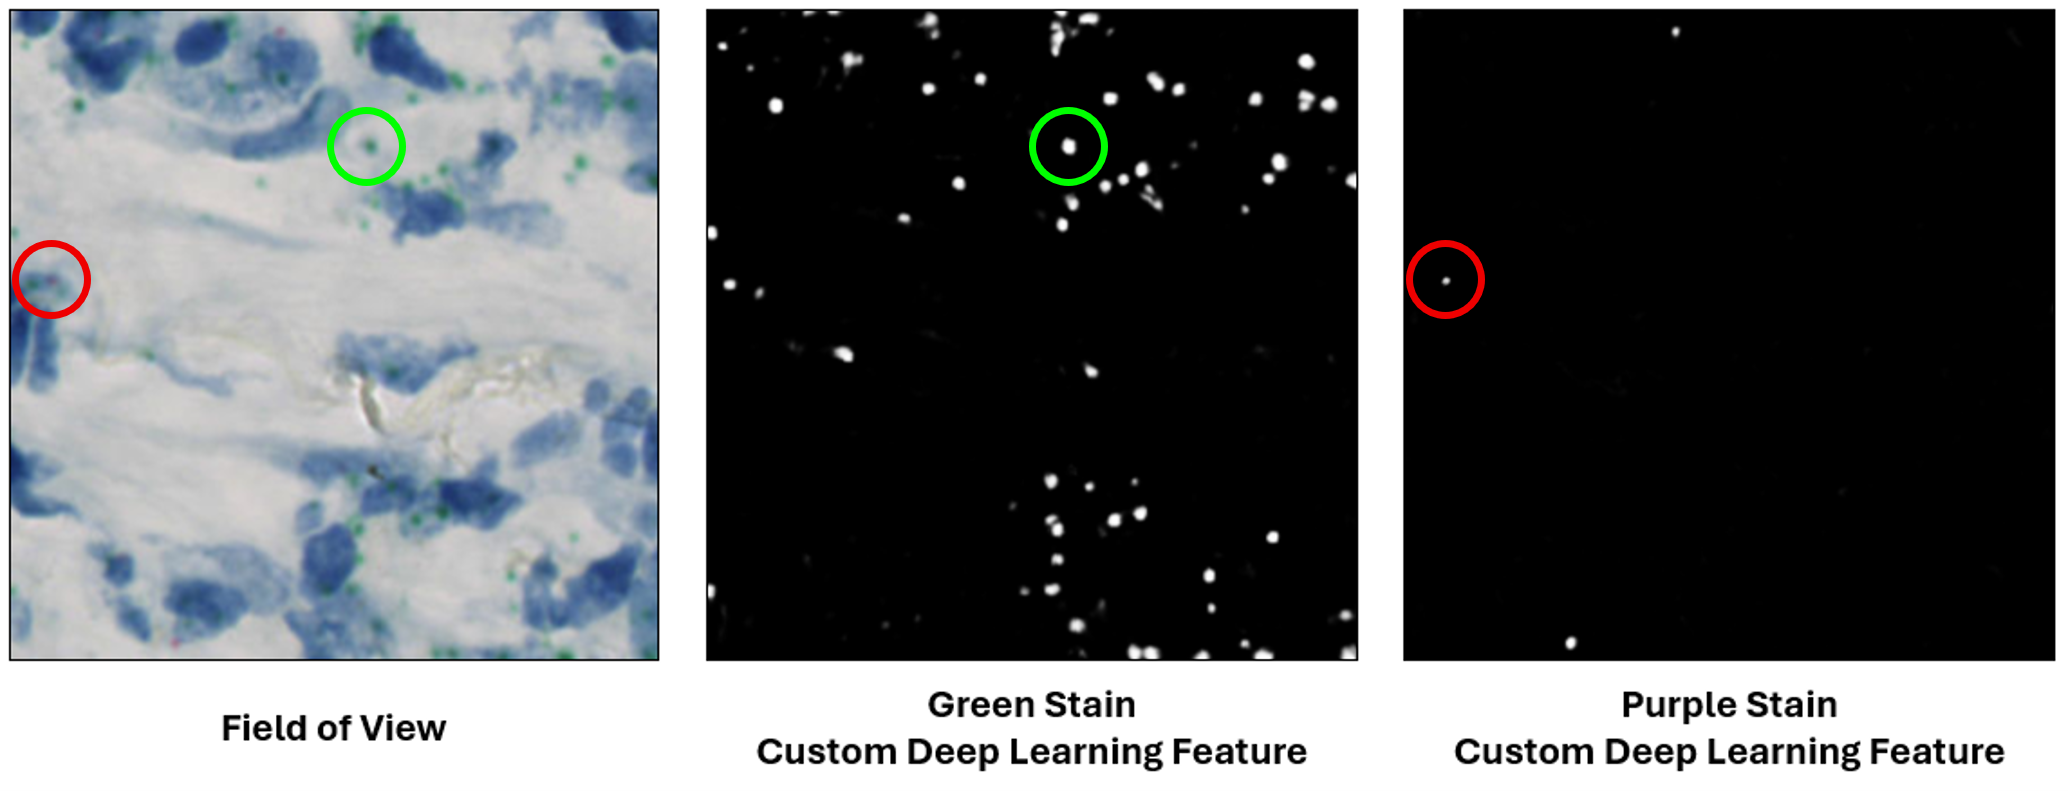
Figure 3: Custom Deep Learning Model Performance. A) Example tissue area with green and purple chromogen probes, and the associated B) custom deep learning green stain, and C) custom deep learning purple stain, both suppressing haematoxylin counterstaining and artefacts. The green circle highlights an example of a green probe, and the red circle highlights an example of a purple probe. In the features, a positive probe signal presents as a peak of white pixels.
This project illustrates how the choice of chromogenic stains in multiplexed assays can have a significant impact on downstream images analysis. Similar colour profiles between stains and artefacts or intense counterstains can reduce the reliability of conventional optical density-based approaches. By leveraging AI to generate individual features for each stain of interest this workflow achieved improved stain separation, with reduced interference from artefacts and counterstains, resulting in a more dependable pipeline with great generalisability.
As assay complexity in brightfield IHC continues to grow, AI-powered stain separation provides a practical and scalable solution for robust quantitative image analysis.
This project illustrates how the choice of chromogenic stains in multiplexed assays can have a significant impact on downstream images analysis. Similar colour profiles between stains and artefacts or intense counterstains can reduce the reliability of conventional optical density-based approaches. By leveraging AI to generate individual features for each stain of interest this workflow achieved improved stain separation, with reduced interference from artefacts and counterstains, resulting in a more dependable pipeline with great generalisability.
As assay complexity in brightfield IHC continues to grow, AI-powered stain separation provides a practical and scalable solution for robust quantitative image analysis.
To learn more about how OracleBio can help you with your quantitative digital pathology requirements, get in touch.
How OracleBio can support you
Why work with OracleBio?
Stay up to date with OracleBio
Sign up to our mailing list to stay informed about news, webinars, events and more