
In this article, Image Analysis Scientist, Jo Lightbody, outlines OracleBio’s approach to calculating the Normalised Membrane Ratio (NMR) using the ‘Membrane Seg (HALO AI)’ Module, combined with custom Python scripting.
While traditional data outputs like H-scores and percent positivity provide useful insights, they may not fully capture the sub-cellular relationship of biomarker expression. This is particularly important when assessing targets for membrane-binding therapies such as antibody-drug conjugates (ADCs).
By introducing the NMR output into our analysis pipeline, we aim to provide a more nuanced, quantitative view of biomarker localisation at the cellular level.
Here, we will outline the workflow we’ve developed, highlight the technical considerations involved, and explain how this methodology supports both exploratory research and high-priority drug development studies.
Background
A major challenge with many chemotherapeutic drugs is that the lack of specificity and off target effects of the drug leads to severe, life-limiting side effects for patients. To combat this, antibody-drug conjugates (ADCs), combine the specificity of monoclonal antibodies and the cytotoxicity of chemotherapy to reduce off-target toxicity and increase treatment precision (Riccardi et al, 2023).
Staining tumour samples by immunohistochemistry (IHC) can help identify the expression level and cellular distribution of potential ADC target proteins. This is particularly useful at the R&D stages of drug development, but also in the clinical environment to predict treatment response.
Normalised Membrane Ratio (NMR) is a metric that reflects the relative intensity of a membrane-associated signal versus the cytoplasmic signal (Garassino et al., 2024). An NMR value gives us a different perspective on the relationship of biomarker expression in the cell membrane vs. the cell cytoplasm that is missed by solely looking at a H-score.
Processes & Workflow
To support sub-cellular quantification for ADC targets, OracleBio established a workflow combining advanced image analysis (IA) modules from the Indica Labs HALO® platform we use internally, with custom-made Python scripts from our internal computational group.
NMR values aren’t directly available from the HALO software, so collaboration between IA and Computer Scientists was necessary to build a custom workflow to generate such data (Figure 1). In addition to quantitative intensity data, there is also potential to capture the spatial context of individual cells within the tissue, allowing assessment of cell–cell relationships and local microenvironment effects.

Figure 1. Workflow for Analysis Prior to NMR Calculation: The process begins with tumour detection, where tissue regions are classified using color-coded masks: tumour (orange), stroma (cyan), white space (grey), and necrosis (purple), to ensure analysis is restricted to tumour regions.
This is followed by AI-powered segmentation: membrane segmentation (green mask over DAB-stained membranes) and nuclear segmentation (green mask over haematoxylin-stained nuclei), refined using annotations from expert IA Scientists. Combining the membrane and nuclear segmentations enables compartmentalisation of each cell into nucleus, cytoplasm, and membrane. Intensity thresholds are then applied within each compartment to generate a visual overlay of cells based on staining intensity: weak (yellow), moderate (orange), and strong (red).
Finally, the data is exported to Python at the Data Processing stage, where compartment-specific optical density (OD) values are used to calculate the NMR value for each cell. Biomarker example was stained and scanned at IQVIA Laboratories.
The HALO ‘Membrane Seg (HALO AI)’ Module enables detection of membrane staining across a tissue. For situations where the pre-trained template requires fine tuning to a particular tissue set or staining profile, this can be performed by creating additional manual annotations (Fig 2.A) and further training the neural network to maximise the accuracy of the analysis module.
Accurately capturing the nuclei and membranes present is important (Fig 2.B) to differentiate the three cell compartments (Fig 2.C). After establishing thresholds for weak, moderate and strong marker positivity, this analysis allows us to compare the stain intensity between the cell cytoplasm and membrane (Fig 2.D). This also produces the standard ‘Membrane Seg (HALO AI)’ Module outputs from the analysis ROI which include:
- the number of cells that are marker positive and negative per mm2
- the percentage of cells that are positive
- the staining intensity (number of cells split into weak, moderate, and strong)
- a calculated H-score
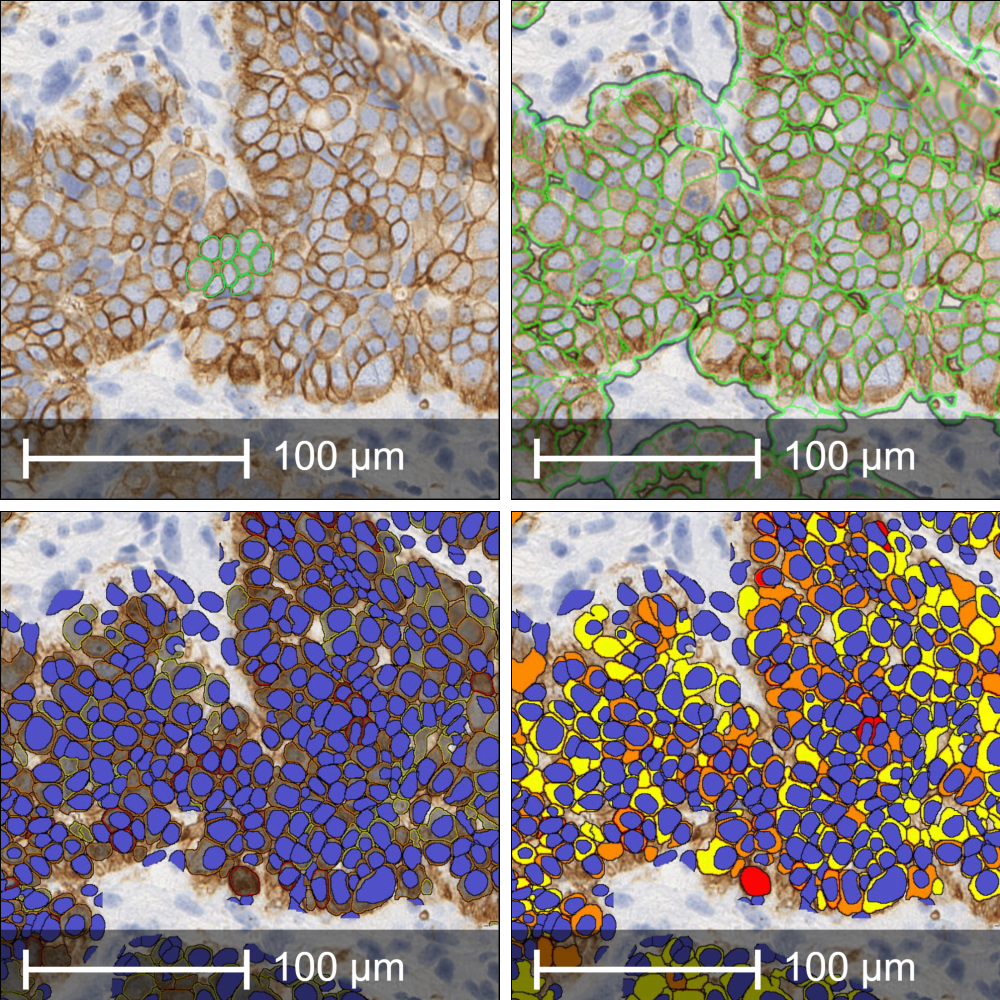
Figure 2. (A) Manual annotations overlaid on the DAB-stained image, used to further train the HALO AI ‘Membrane Seg’ module for improved segmentation accuracy tailored to the specific tissue and stain profile. (B) Resulting membrane segmentation mask generated by the trained model, highlighting cell membranes across the tissue section. (C) Integration of nuclear segmentation allows delineation of three distinct cellular compartments: nucleus, cytoplasm, and membrane. (D) Application of intensity thresholds to each compartment enables classification of staining into weak (yellow) , moderate (orange), and strong (red) positivity, supporting quantitative, compartment-specific analysis of membrane and cytoplasmic staining. Biomarker example was stained and scanned at IQVIA Laboratories.
The custom Python scripts developed by our Computer Scientists are based on the following NMR equation (Garassino et al., 2024) below:

Optical density (OD) is the measure of signal intensity from IHC staining, and when used to calculate the NMR, it helps to differentiate between staining in the membrane compared to the cytoplasm. As this is a continuous scoring method, it captures subtle differences in cell’s NMR, as opposed to grouping them into categories. Cells with more staining in the membrane than cytoplasm have a higher NMR value than those with less contrast between the two compartments (Fig 3).
This can provide a deeper understanding of the relationship between cytoplasm/membrane target expression, patient specific tumour biology, and therapeutic response to therapies such as ADCs. The standard outputs of the ‘Membrane Seg (HALO AI)’ Module are altered by configuring the algorithm to export OD values for individual subcellular compartments. Running the custom Python scripts on the exported data generates both the NMR value per cell object and an NMR average per image analysed.

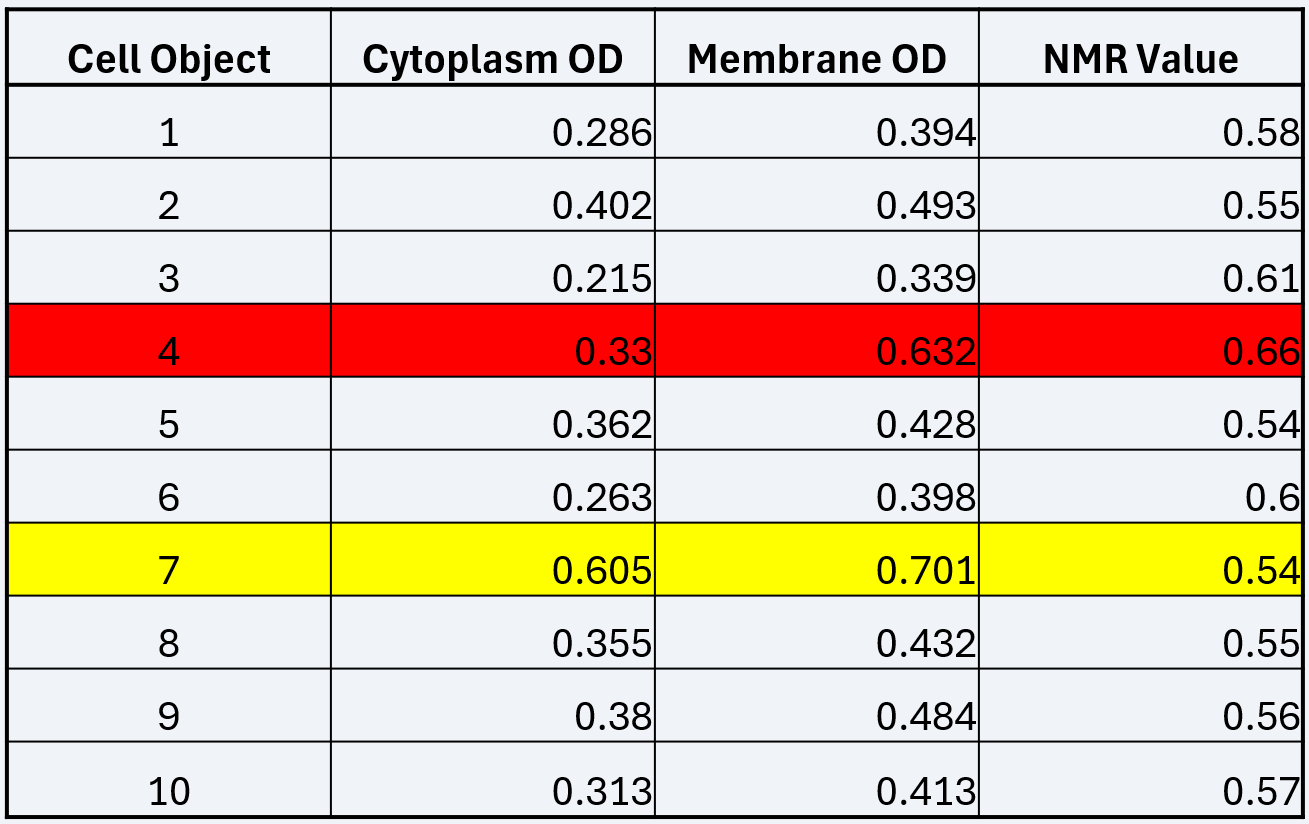
Figure 3. Example NMR Data. High magnification image showing individual cells with corresponding quantitative data used to calculate the NMR value. A table alongside the image displays example values for membrane OD, cytoplasm OD, and the resulting NMR for each cell. The lowest NMR value is highlighted in yellow and the highest in red, corresponding to the visual intensity of membrane staining observed in the respective cells. This illustrates how the continuous NMR scoring method captures subtle differences in membrane-localised staining intensity across individual cells. Biomarker example was stained and scanned at IQVIA Laboratories.
While the ‘Membrane Seg (HALO AI)’ Module can accurately measure OD of DAB staining in sub-cellular compartments, there are a number of caveats that require consideration. The analysis relies heavily on the quality of the tissue and sectioning as the generation of cell objects is reliant on complete membrane staining, whether a nucleus is present or not. When a nuclei is not present it is usually due to the sectioning plane.
We can use custom Python scripting at the data processing stage to remove any non-nucleated cell objects from the data set, and through our internal quality control (QC) process, we can ensure that any artefacts that may have an impact on the analysis are removed prior to running the algorithm. For more information please read our Membrane Segmentation case study.
In Summary
ADCs are transforming cancer therapies by combining the precision of targeted treatments with the potency of cytotoxic drugs. The clinical success of these drugs relies on identifying patients who will respond to them. Quantitative digital pathology tools, such as the Indica Labs ‘Membrane Seg (HALO AI)’ Module, enables the distinction of membrane and cytoplasmic-specific staining from total cellular staining.
This makes it possible to calculate NMR values to inform more personalised treatment decisions providing a deeper understanding of a drugs therapeutic potential, particularly important for membrane targeted therapies such as ADCs.
Despite the previously mentioned challenges in this process, OracleBio’s Image Quality Control (QC) measures, IA expertise, and Python scripting capabilities means that we can extract high quality NMR data on a per cell basis, along with their spatial context to other cells, from the images provided.
The digital pathology field continues to evolve with the release and adoption of new tools and modules. As a result, OracleBio’s capabilities evolve and grow, driven by our commitment to continuous innovation and development for the benefit of our clients.
Our in-depth knowledge of Indica Labs HALO and its advanced features is a key feature of this, allowing OracleBio to conduct cutting edge image analysis and data processing. Accessing these capabilities is best done using OracleBio’s FTE resource model, a contracting model designed to promote and share with a client continuous learning, under a flexible and collaborative working partnership.
References
- M.C. Garassino, J. Sands, L. Paz-Ares, A. Lisberg, M. Johnson, M. Pérol, D. Carroll, H. Sade, A. Kapil, V. Haddad, D. Uema, M.-J. Ahn, PL02.11 Normalized Membrane Ratio of TROP2 by Quantitative Continuous Scoring is Predictive of Clinical Outcomes in TROPION-Lung 01,Journal of Thoracic Oncology, Volume 19, Issue 10, Supplement, 2024, Pages S2-S3, ISSN 1556-0864, Avaliable at: https://doi.org/10.1016/j.jtho.2024.09.015.
- Riccardi F, Dal Bo M, Macor P, Toffoli G. A comprehensive overview on antibody-drug conjugates: from the conceptualization to cancer therapy. Front Pharmacol. 2023 Sep 18;14:1274088. doi: 10.3389/fphar.2023.1274088. PMID: 37790810; PMCID: PMC10544916.
How OracleBio can support you
Why work with OracleBio?
Stay up to date with OracleBio
Sign up to our mailing list to stay informed about news, webinars, events and more